
Bulletin of the CDD
| Product name | Short name | Description | Time period | Download |
|---|---|---|---|---|
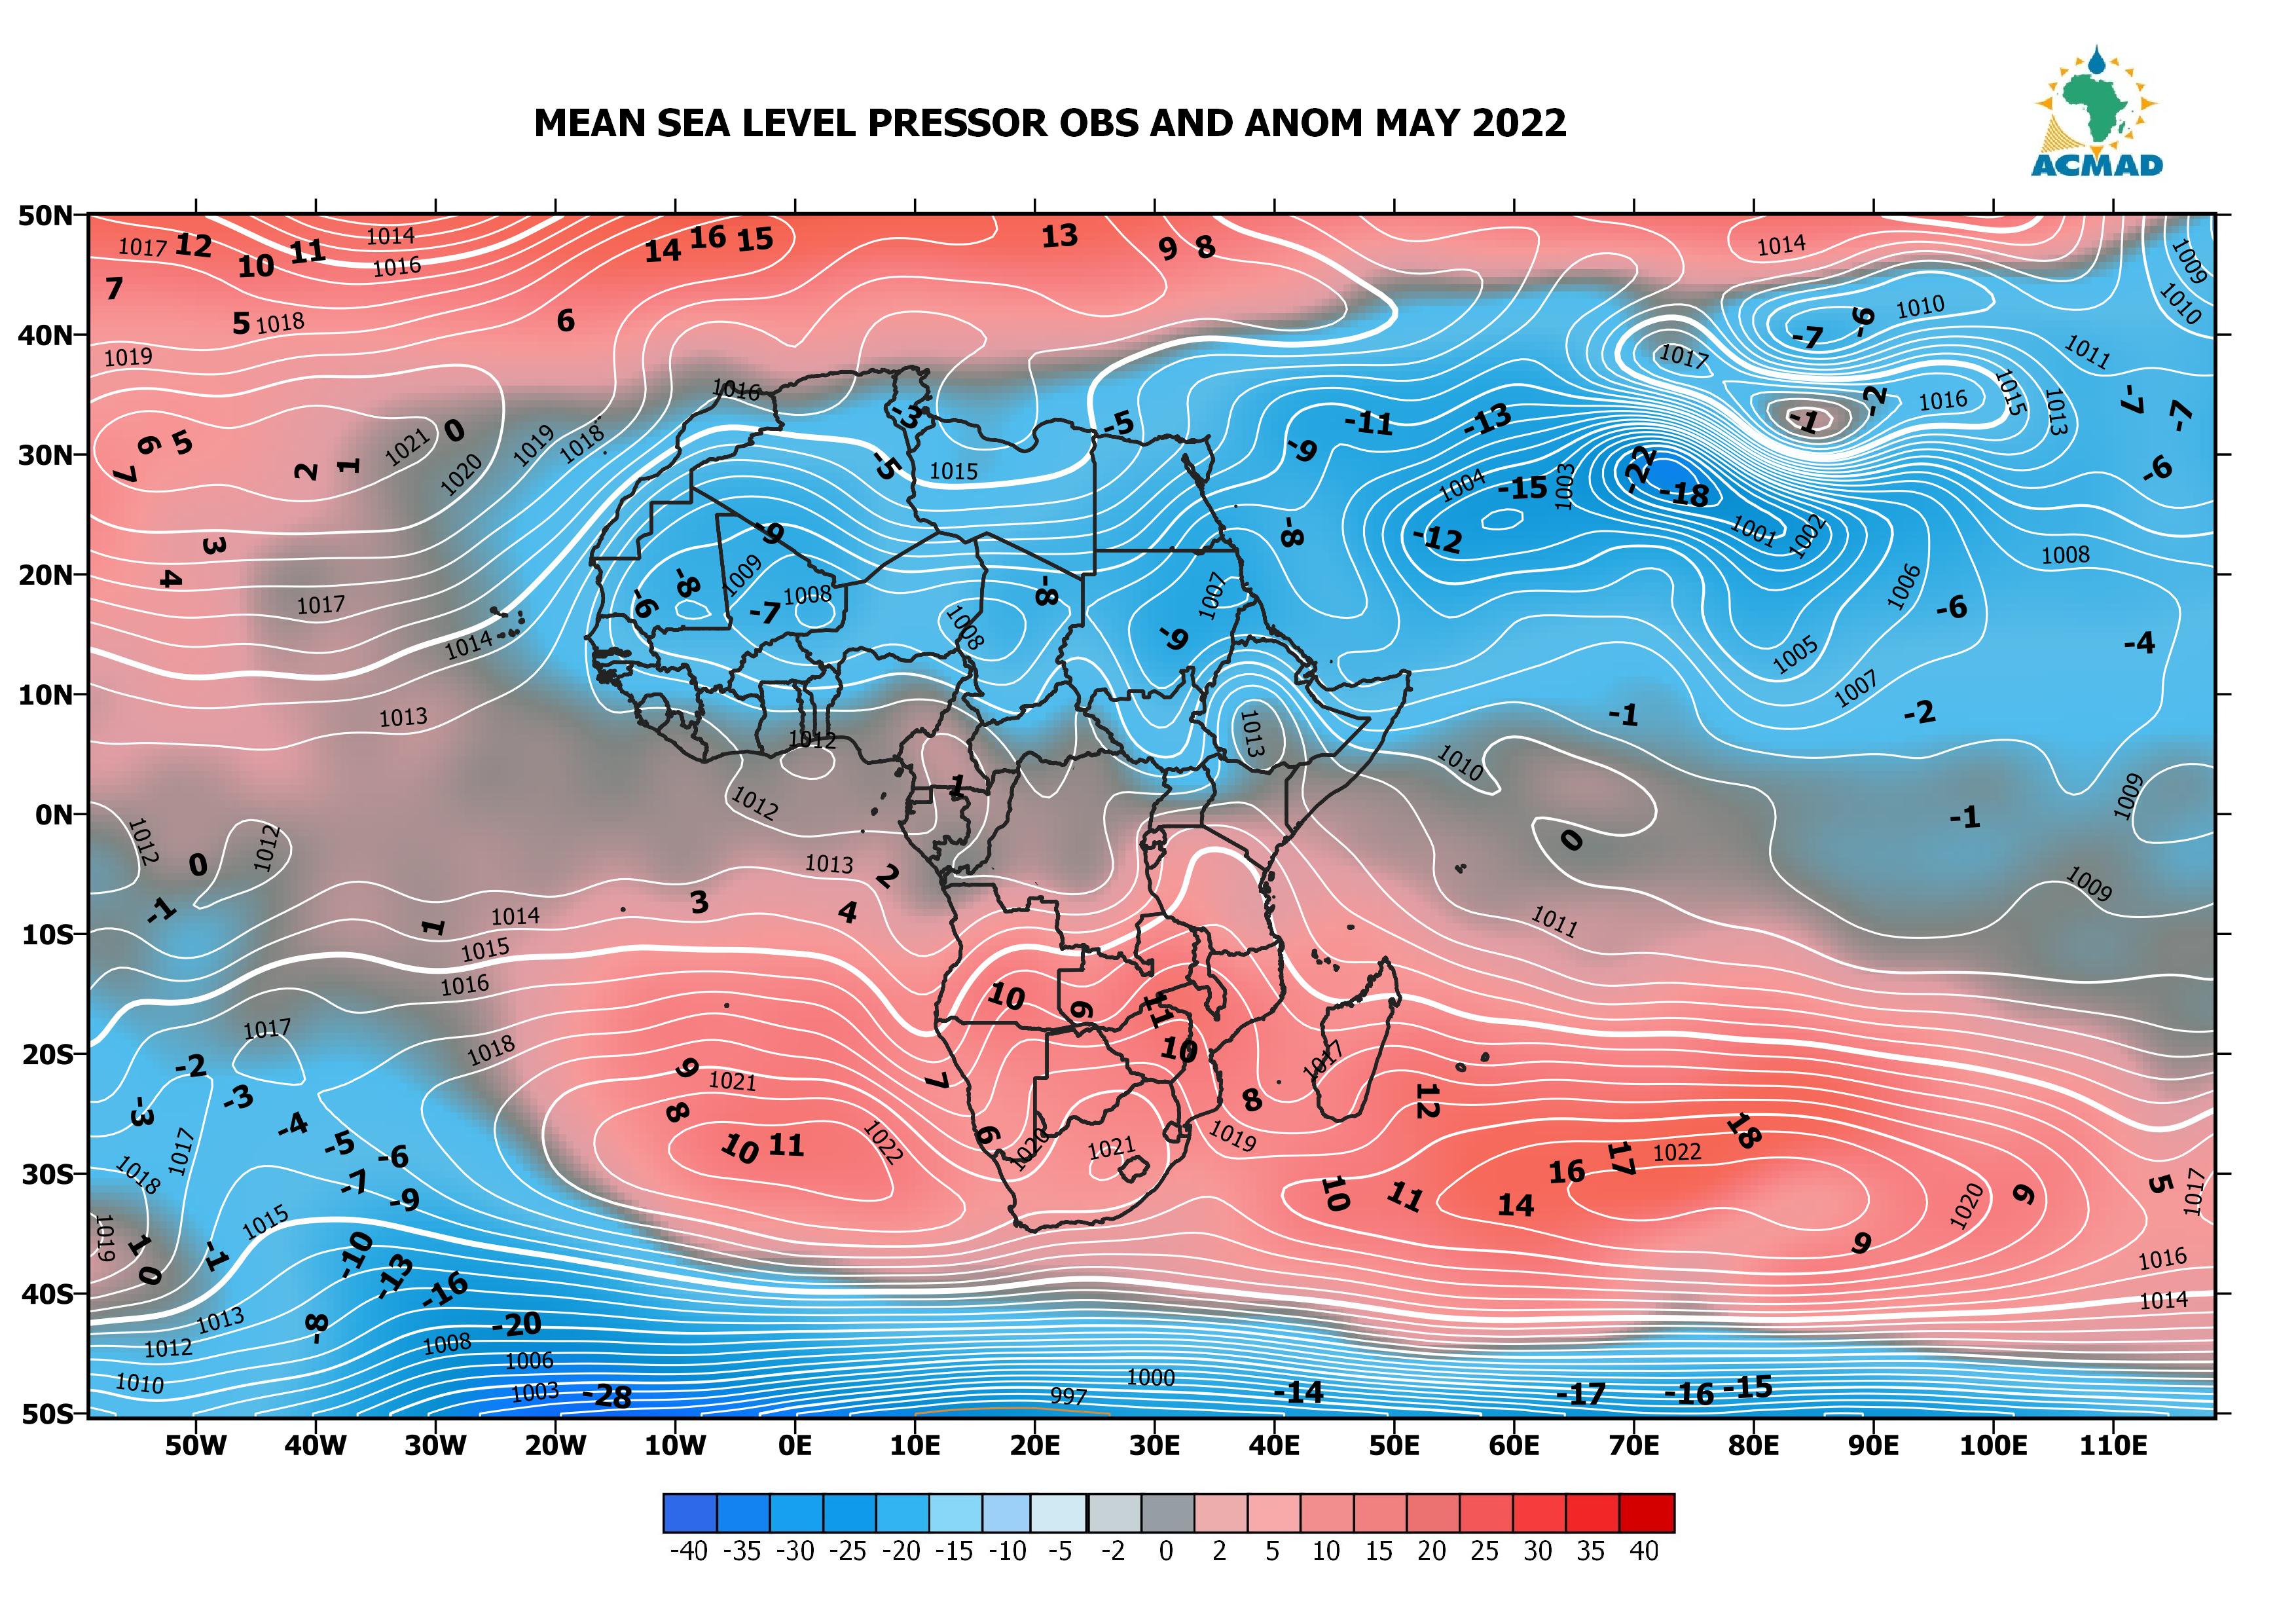
| Mean sea level pressure | MLSPM | This is a contour map of monthly average sea level pressure and anomalies for the globe with respect to the 1981-2010 climatology. | Month | PNG CSV Geojson |
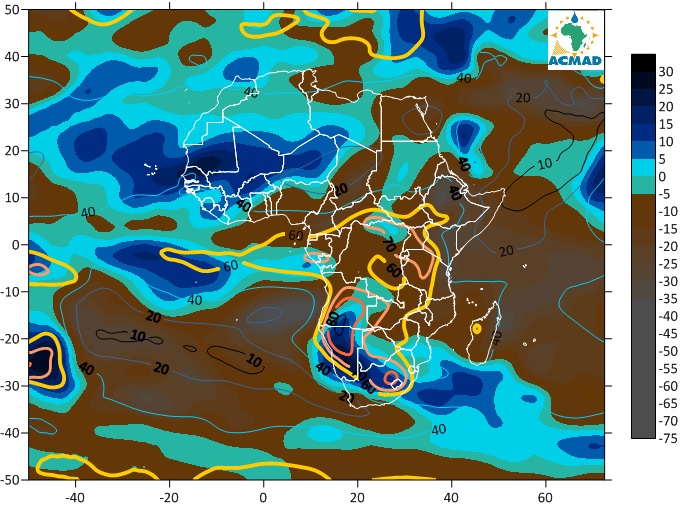
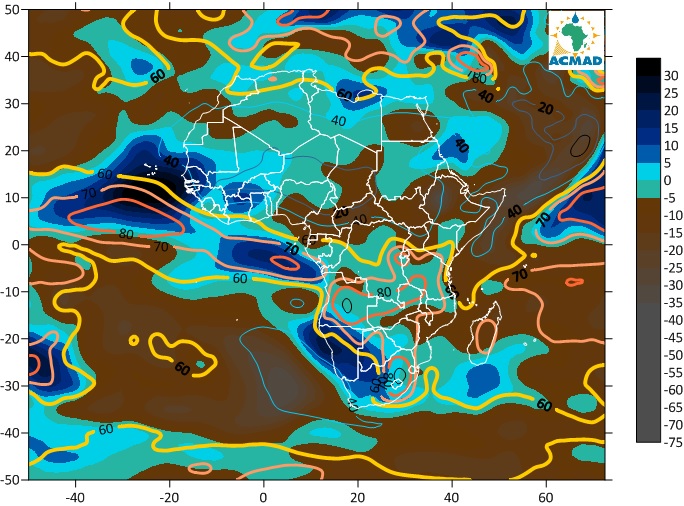
| Relative humidity and anomaly at 700 hPa | RHM700hPa | This is a contour map of monthly Relative Humidity and anomalies at 700 hPa for Africa with respect to the 1981-2010 climatology. | Month | PNG CSV Geojson |
| Relative humidity and anomaly at 850 hPa | RHM850hPa | This is a contour map of monthly Relative Humidity and anomalies at 850 hPa for Africa with respect to the 1981-2010 climatology. | Month | PPNG CSV Geojson |
| Wind anomaly at 850 hPa | WA | This product shows wind direction and anomaly at 850 hPa level. | Month | PNG CSV Geojson |
| Sea surface temperature map | SST Map | Monthly sea surface temperature anomalies are calculated with respect to the 1971-2000 climatology. | Month | PNG CSV Geojson |
| Plume of Model ENSO Prediction | Plume_ENSO | Forecasts by dynamical and statistical models over Niño 3.4 (5°N–5°S, 120°W–170°W) region. | Month | |
| Monthly precipitation in percent of average | Prec%_M | Total precipitation in percentage of average is based on the formula: P(%)= Total current precipitation/long term (1981-2010) average of precipitation X 100 | Month | |
| Seasonal precipitation in percent of average | Prec%_M | Total precipitation in percentage of average is based on the formula: P(%)= Total current precipitation/long term (1981-2010) average of precipitation X 100 | Month | PNG CSV Geojson |
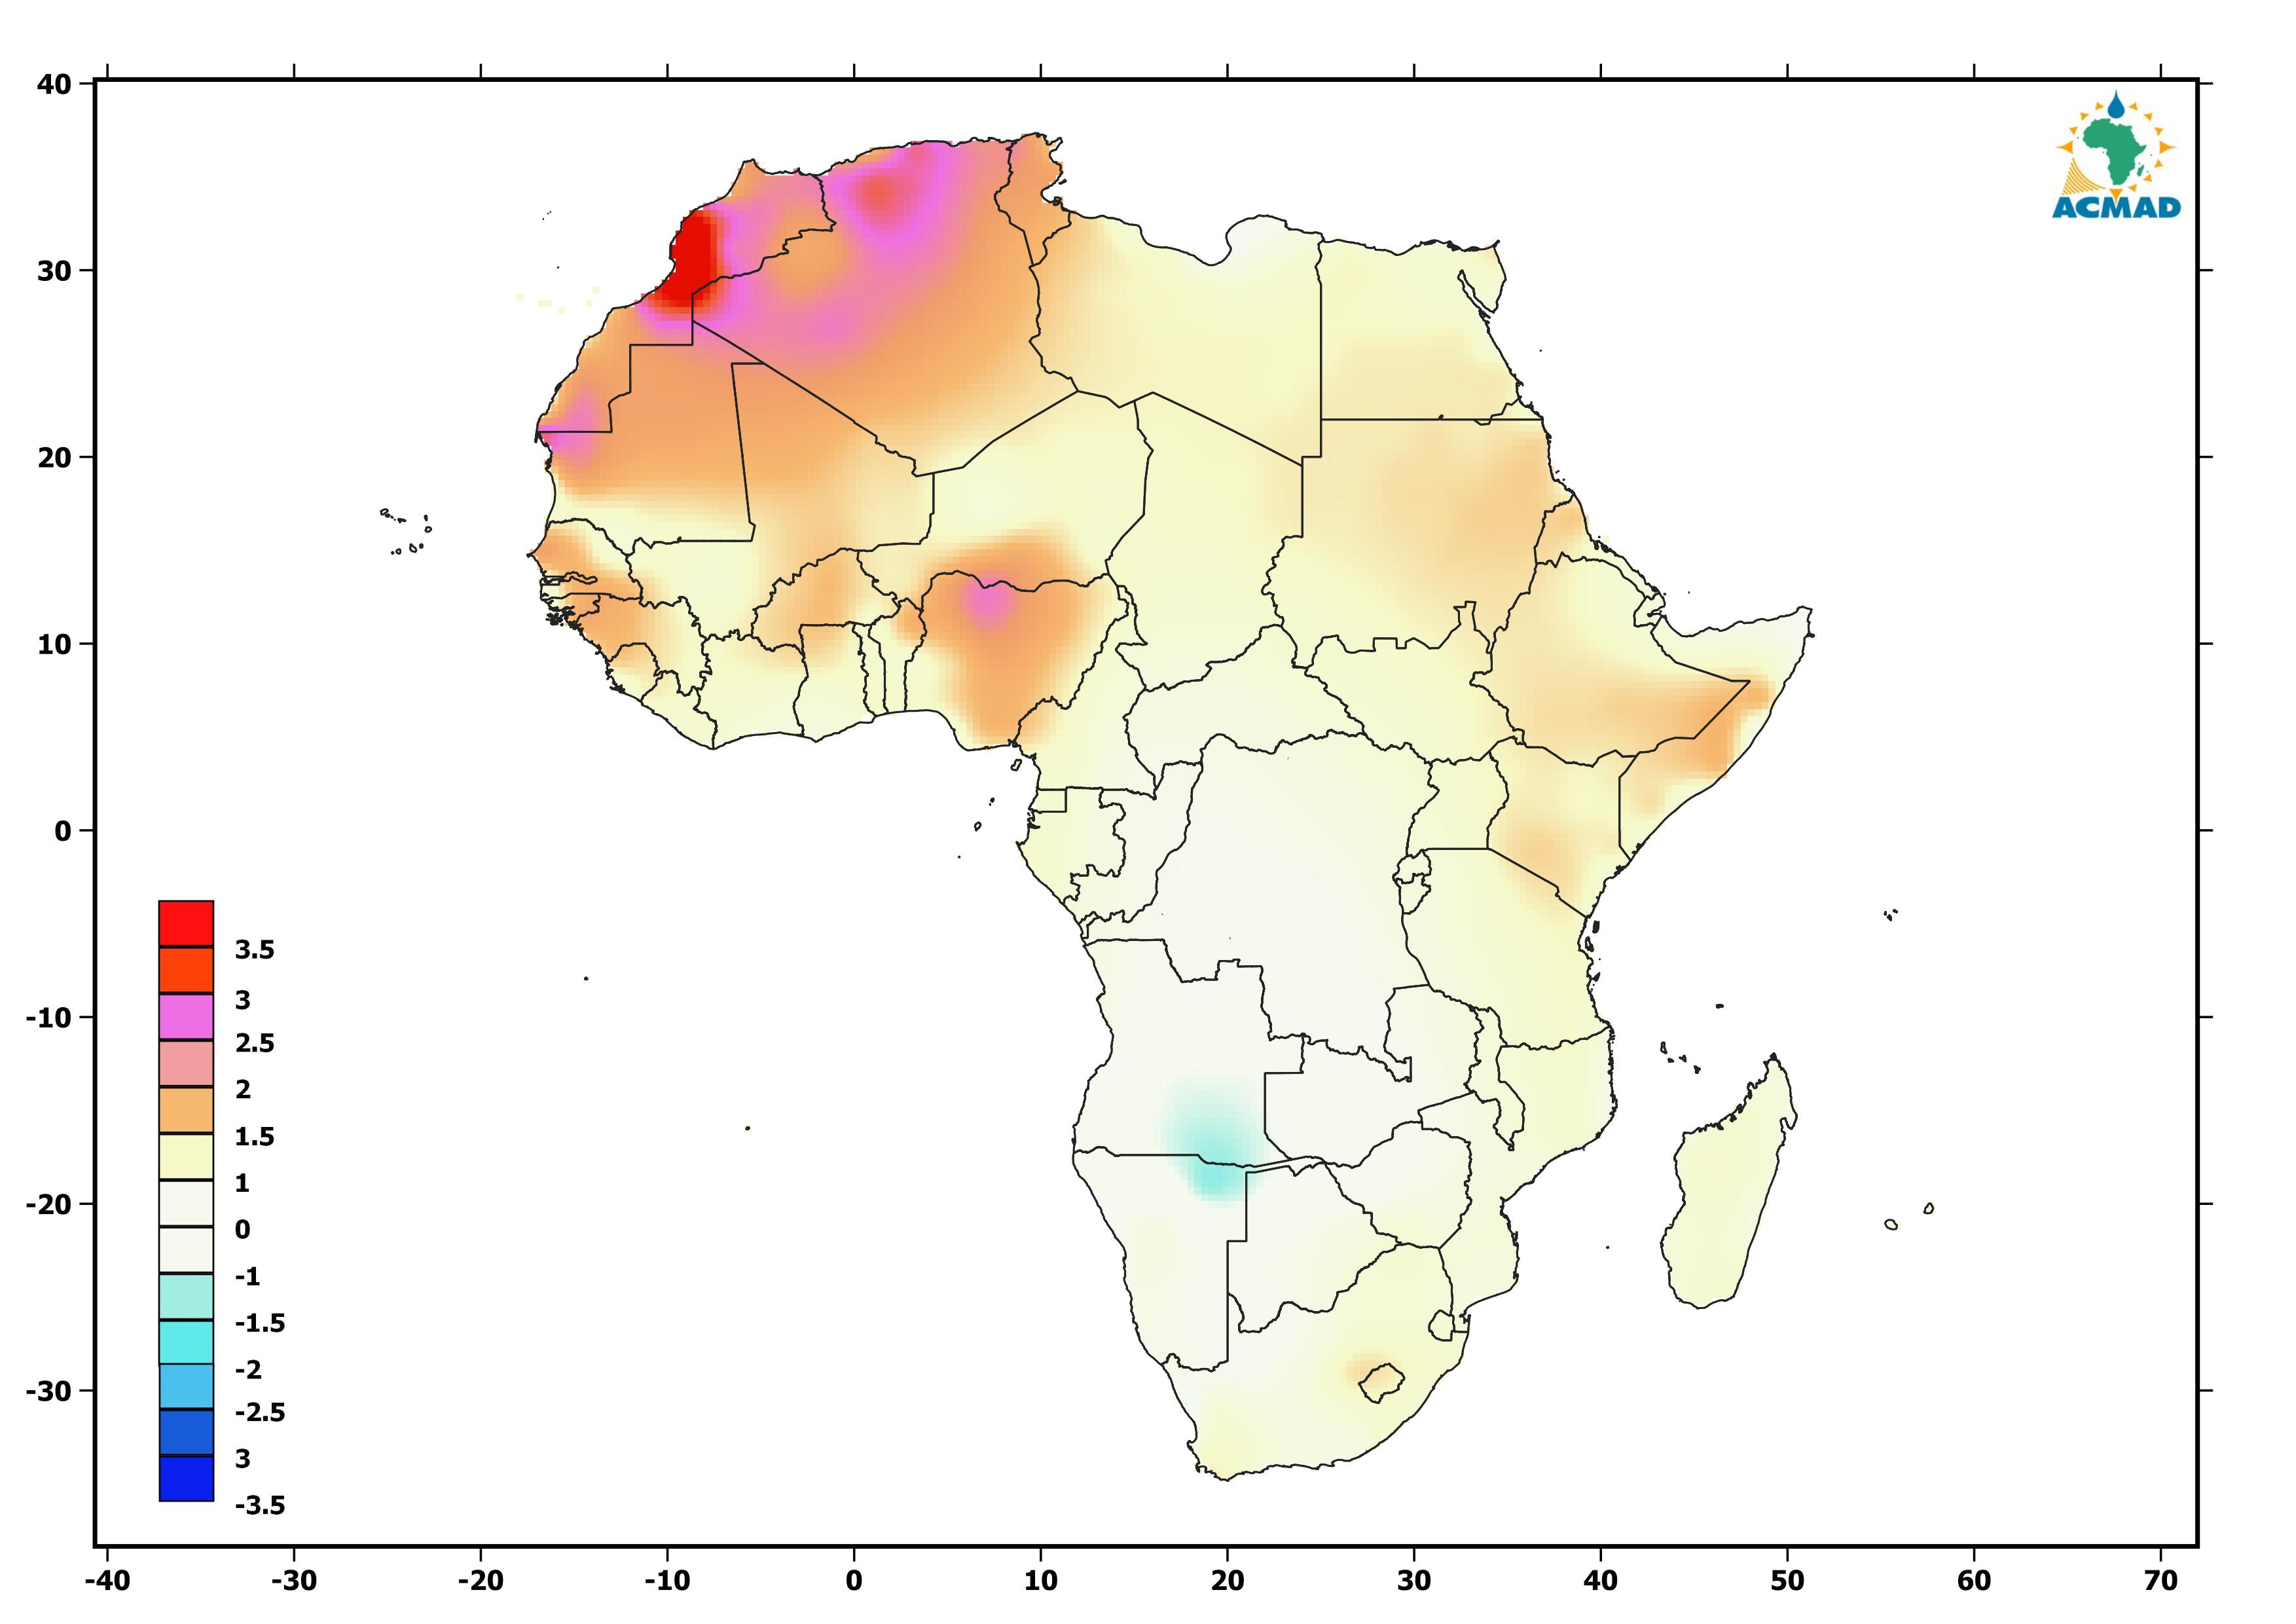
| Monthly Temperature Anomaly | MTA | Monthly temperature anomalies are calculated using estimated numerical data with respect to the 1971-2000 climatology | Month | PNG CSV Geojson |
| Seasonal Temperature Anomaly | STA | Monthly temperature anomalies are calculated using estimated numerical data with respect to the 1971-2000 climatology | Month | PNG CSV Geojson |
| Seasonal precipitation forecast | Prec_FC | A seasonal forecast therefore is a forecast of how the coming season is likely to be different from climatology in 3 categories Above, Near and Below normal | Seasonal | PNG CSV Geojson |
| Seasonal temperature forecast | Temp_FC | It is a forecast of how the coming season is likely to be different from climatology in 3 categories Above, Near and Below normal | Seasonal | PNG CSV Geojson |
| Product name | Short name | Description | Time period | Download |
|---|---|---|---|---|
| Significant wather and climate events map | SWCE | It is based on the analysis of continental seasonal forecasts providing likely expected hazards related to predicted climate anomalies ( see practical guide for seasonal forecasting) | Seasonal | PNG GeoTiff Geojson |
| Monthy precipitation in percent of average | Prec% | Total precipitation in percentage of average is based on the formula: P(%)= Total current precipitation/long term (1981-2010) average of precipitation X 100 | Month | PNG GeoTiff Geojson |
| Standardized Precipitation Index | SPI | The SPI is a statistical monthly indicator that compares the cumulated precipitation during a period of n months with the long-term cumulated precipitation distribution for the same location and accumulation period | Month | PNG GeoTiff Geojson |
| Soil moisture anomaly | SMA | The soil moisture product has been chosen for agricultural drought monitoring. It is estimated through atmospheric/hydrological models. Soil moisture anomaly is the difference between current value and long term average (1981-2010). | Month | PNG GeoTiff Geojson |
| vegetation index anomaly | NDVI | The NDVI can be used to measure and monitor plant growth, vegetation cover, and biomass production. | Month | PNG GeoTiff Geojson |
| Water level | WL | Sentinel-3A use Altimetric gauging of river and lake water levels as one of mission objectives connected to requirements for water resources management, elevation of the surface of certain inland water bodies and large rivers and flood risk monitoring (see procedure) | Month | PNG GeoTiff Geojson |
| Seasonal precipitation forecast | Prec_FC | It is a forecast of how the coming season is likely to be different from climatology in 3 categories Above, Near and Below normal | Seasonal | PNG GeoTiff Geojson |
| Seasonal temperature forecast | Temp_FC | It is a forecast of how the coming seasonal temperature is likely to be different from climatology in 3 categories Above, Near and Below normal | Seasonal | PNG GeoTiff Geojson |
| African drought monitor | The Africa Drought Monitor focuses on continental, broad-scale conditions by creating composites of Meteorological drought and agricultural with four drought indicator categories. Variables used include; precip in percent of average, soil moisture anomaly, NDVI water levels and SPI ( see practical guide for drought monitor) | Month | PNG GeoTiff Geojson |
Seasonal climate forecast bulletin
It is a probabilistic forecast. It involves assessment of outputs from global multimodel ensemble forecasting systems, statistical seasonal forecasting tools, trend analysis as well as the available findings from climate studies at local, national, regional, global levels and expert judgement.| Product name | Short name | Description | Time period | Download |
|---|---|---|---|---|
| Seasonal precipitation forecast | Prec_FCT | It is a forecast of how the coming seasonal precipitation is likely to be different from climatology in 3 categories Above, Near and Below ( see seasonal forecasting practical guide ) | Seasonal | PNG GeoTiff Geojson |
| Seasonal temperature forecast map | Temp_FCT | It is a forecast of how the coming seasonal temperature is likely to be different from climatology in 3 categories Above, Near and Below normal | Seasonal | PNG GeoTiff Geojson |
| African seasonal precipitation average map (125%) | 125% average | The African seasonal precipitation average is based on reference period 1981-2010. The threshold 125% depicts areas under significant excess precipitation. | Seasonal | PNG GeoTiff Geojson |
| African seasonal precipitation average map (75%) | 75% average | The African seasonal precipitation average is based on reference period 1981-2010. The threshold 75% depicts areas under significant deficits or drought. | Seasonal | PNG GeoTiff Geojson |
Ten Day Climate Watch Bulletin
| Product name | Short name | Description | Time period | Link |
|---|---|---|---|---|
| Mean sea level pressure | MLSPD | This is a contour map of monthly average sea level pressure and anomalies for the globe with respect to the 1981-2010 climatology. | Ten days | View |
| Inter-Tropical Discontinuity (ITD), Inter-Tropical Convergence Zone (ITCZ) and Congo Air Boundary (CAB) Map | ITD-ITCZ-CAB | The mean position of ITD, CAB and ITCZ for first, 2nd and 3rd dekads and their maximum and minimum displacements, respectively | Ten days | |
| Relative humidity and anomaly at 700 hPa | RHD | This is a contour map of monthly Relative Humidity and anomalies at 700 hPa for Africa with respect to the 1981-2010 climatology. | Ten days | View |
| Relative humidity and anomaly at 850 hPa | RHD | This is a contour map of monthly relative humidity and anomalies at 850 hPa for Africa with respect to the 1981-2010 climatology. | Ten days | View |
| African Monsoon | Wind 700 to 850 hPa | This product shows wind direction and anomaly at 700 and 850 hPa level. This makes it possible to examine the intensity of the West African monsoon at different levels. | Ten days | View |
| Mean wind at 200 hPa | Wind at 200 hPa | This product shows wind speed and anomaly at 200 hPa level. It shows the position of Tropical EasterlyJet and Subtropical Jet | Ten days | View |
| Dust loading particles | DLD | Daily average dust loading is computed as the mean value of the forecasts with lead times ranging from 0 to 21 hours | Ten days | View |
| Surface dust concentration | DCD | Daily averages of surface dust concentration is computed as the mean value of the forecasts with lead times ranging from 0 to 21 hours | Ten days | View |
| Precipitation in percent of average | Prec%_D | Total precipitation in percentage of average is based on the formula: P(%)= Total current precipitation/long term (1981-2010) average of precipitation X 100 | Ten days | View |
| weekly precipitation forecast for one week ahead | PreFC_W | Precipitation forecast based on analysis of Weekly observed precipitation , Weekly precipitation climatology,MJO observed and forecasted, Precipitable water forecast, Zonal wind, Wind anomalies forecast, Divergence, Weekly NCEP/GFS Ensemble Forecasts precipitation and NAO (see practical guide). | Week | View |
| weekly precipitation forecast for 2nd week ahead | PreFC_W | Precipitation forecast based on analysis of Weekly observed precipitation , Weekly precipitation climatology,MJO observed and forecasted, Precipitable water forecast, Zonal wind, Wind anomalies forecast, Divergence, Weekly NCEP/GFS Ensemble Forecasts precipitation and NAO (see practical guide). | Week | View |
| weekly temperature anomaly forecast | TempFC_W | The climate outlook for temperature shows the means over day 0-8 and day 9-16 plus the departure of the first 8-day mean from the CRU 100-yr climatology. | Week | View |
| weekly soil moisture forecast | SMF_W | The climate outlook for soil moisture shows the current analysis and the forecasted change over the next 8 days. | Week | View |
| Mslp anomaly maps of week 1, 2, and 3 | mslp | Mslp anomaly maps of week 1, 2, and 3 computed using 51 ensembles and the 20 years of hindcast | Week | |
| u10 anomaly maps of week 1, 2, and 3 | u10 | u10 anomaly maps of week 1, 2, and 3 computed using 51 ensembles and the 20 years of hindcast | Week | |
| v10 anomaly maps of week 1, 2, and 3 | v10 | v10 anomaly maps of week 1, 2, and 3 computed using 51 ensembles and the 20 years of hindcast | Week | |
| soil moisture anomaly maps of week 1, 2, and 3 | sm20 | soil moisture anomaly maps of week 1, 2, and 3 computed using 51 ensembles and the 20 years of hindcast | Week | |
| air temperature anomaly maps of week 1, 2, and 3 | t2m | air temperature anomaly maps of week 1, 2, and 3 computed using 51 ensembles and the 20 years of hindcast | Week | |
| dew point temperature anomaly maps of week 1, 2, and 3 | d2m | dew point temperature anomaly maps of week 1, 2, and 3 computed using 51 ensembles and the 20 years of hindcast | Week | |
| precipitation anomaly maps of week 1, 2, and 3 | precip | precipitation anomaly maps of week 1, 2, and 3 computed using 51 ensembles and the 20 years of hindcast | Week | |
| Dekadal precipitation anomaly maps of dekad 1, 2, and 3 | precip | Dekadal precipitation anomaly maps of dekad 1, 2, and 3 computed using 51 ensembles and the 20 years of hindcast | Week | |
| Precipitation anomaly probability maps of week 1, 2, and 3 | prob | Precipitation anomaly probability maps of week 1, 2, and 3 computed using 51 ensembles and the 20 years of hindcast | Week | |
| Extreme rainfall probability maps of week 1, 2, and 3 | prob | Extreme rainfall probability maps of week 1, 2, and 3 computed using 51 ensembles and the 20 years of hindcast (50 mm, 75 mm, 100 mm, 150 mm, 200 mm, and 250 mm) | Week | |
| Probability of extreme rainfall anomaly maps of week 1, 2, and 3 | prob | Probability of extreme rainfall anomaly maps of week 1, 2, and 3 computed using 51 ensembles and the 20 years of hindcast | Week | |
| convective available potential energy anomaly maps of week 1, 2, and 3 | CAPE | convective available potential energy anomaly maps of week 1, 2, and 3 computed using 51 ensembles and the 20 years of hindcast | Week | |
| ongoing longwave radiation anomaly maps of week 1, 2, and 3 | ttr | ongoing longwave radiation anomaly maps of week 1, 2, and 3 computed using 51 ensembles and the 20 years of hindcast | Week | |
| precipitable water anomaly maps of week 1, 2, and 3 | water_precip | precipitable water anomaly maps of week 1, 2, and 3 computed using 51 ensembles and the 20 years of hindcast | Week | |
| geopotential height anomaly maps of week 1, 2, and 3 | gh | geopotential height anomaly maps of week 1, 2, and 3 computed using 51 ensembles and the 20 years of hindcast at 1000, 925, 850, 700, 500, 300, 200 hPa | Week | |
| Relative humidity anomaly maps of week 1, 2, and 3 | RH | Relative humidity anomaly maps of week 1, 2, and 3 computed using 51 ensembles and the 20 years of hindcast at 1000, 925, 850, 700, 500, 300, 200 hPa | Week | |
| specific humidity anomaly maps of week 1, 2, and 3 | q | specific humidity anomaly maps of week 1, 2, and 3 computed using 51 ensembles and the 20 years of hindcast at 1000, 925, 850, 700, 500, 300, 200 hPa | Week | |
| mean win speed and direction maps of week 1, 2, and 3 | (ff, dd) | mean win speed and direction maps of week 1, 2, and 3 computed using 51 ensembles and the 20 years of hindcast at 1000, 925, 850, 700, 500, 300, 200 hPa | Week | |
| zonal wind speed anomaly maps of week 1, 2, and 3 | u | zonal wind speed anomaly maps of week 1, 2, and 3 computed using 51 ensembles and the 20 years of hindcast at 1000, 925, 850, 700, 500, 300, 200 hPa | Week | |
| meridional wind speed anomaly maps of week 1, 2, and 3 at 850, 700, 500 and 200hpa | v | meridional wind speed anomaly maps of week 1, 2, and 3 computed using 51 ensembles and the 20 years of hindcast at 1000, 925, 850, 700, 500, 300, 200 hPa | Week |
| Product name | Short name | Description | Time period | Download |
|---|---|---|---|---|
| African meningetis belt | AMB | IThe African meningitis belt is a region in sub-Saharan Africa where the occurences of incidence of meningitis is very high. | week | PNG CSV Geojson |
| Relative humidity | RH | IThis is a shaded map of weekly relative humidity at 1000 hPa for Africa with respect to the 1981-2010 climatology. | week | PNG CSV Geojson |
| Meridional wind | MW | IThis is a shaded map of weekly meridional wind at 1000 hPa for Africa with respect to the 1981-2010 climatology. | week | PNG CSV Geojson |
| Surface Dust concentration | DC | IDaily averages of surface dust concentration is computed as the mean value of the forecasts with lead times ranging from 0 to 21 hours | week | PNG CSV Geojson |
| Vigilance map for emergence of meningitis in Africa | VMMap | IIt provides vigilance information for emergence of meningitis, hazards, potential impacts collected from historical records, provides measures and advice (see practical guide) | week | PNG CSV Geojson |
| Product name | Short name | Description | Time period | Download |
|---|---|---|---|---|
| Inter-Tropical Discontinuity (ITD), Inter-Tropical Convergence Zone (ITCZ) and Congo Air Boundary (CAB) Map | ITD-ITCZ-CAB | The mean position of ITD, CAB and ITCZ for first, 2nd and 3rd dekad and their maximum and minimum displacements, respectively (see practical guide) | Monthly | PNG CSV Geojson |
| Surface dust concentration | DC | Daily averages of surface dust concentration is computed as the mean value of the forecasts with lead times ranging from 0 to 21 hours | Monthly | PNG CSV Geojson |
| Relative humidity | RHM | This is a shaded map of monthly relative humidity at 1000 hPa for Africa with respect to the 1981-2010 climatology. | Monthly | PNG CSV Geojson |
| Near surface air mean temperature | 2M TempM | This product shows the means of 2 meter temperature over Africa. | Monthly | PNG CSV Geojson |
| Monthly total precipitation | Tot Prec M | Area where monthly total precipitation was high is a favorable climate condition for mosquito parasites development and malaria prevalence | Monthly | PNG CSV Geojson |
| Vegetation index | EVI | This map shows areas with thick vegetation cover, favorable for mosquito parasites and malaria | Monthly | PNG CSV Geojson |
| Malaria vigilance map | MV | This map indicates vigilance on African malaria Epidemic Risk Zones: high vigilance, moderate vigilance, low vigilance and no vigilance. | Monthly | PNG CSV Geojson |